Let’s be Islands Together | the metrics of loneliness
In the winter of 2023 I spent 28 days installing a live data artwork based on people’s experience of loneliness. I invited people in my community to share as I translated each personal story into a small artwork in real time. These, I wove together into a larger piece which tells a story of belonging.
The physical piece is secondary to the intimate experience of co-creation. By gathering and synthesizing data at the speed of conversation, I explore how we shape community.

“Listening is where love begins: listening to ourselves and then to our neighbours” - Fred Rogers
Loneliness has profound impacts on individual and community health. From dementia and suicide to political polarization, the effects of social isolation are well documented but rarely discussed. As a social species existing in a culture that prioritizes self-reliance, loneliness is both a reality and source of shame for many.
The aim of Let’s be Islands Together is to inspire conversation about our varied experience of loneliness, reducing the stigma, exploring how to build connection and compassion as an antidote to isolation. This interactive project is for anyone who has experienced loneliness. That is to say, all of us.

ARTS BASED RESEARCH
I began exploring the metrics of loneliness as Covid became endemic and the world started to open up. Having anticipated that my own feelings of loneliness and isolation would ease, I was surprised when this failed to be true. I considered ways that I might use my data art practice not only to initiate repair in myself, but to activate my community around the subject.
With an eye towards the role belonging plays in building sustainable communities I chose to begin the project at home, on Vancouver Island. I wanted to examine individual stories of loneliness and how, when seen together, patterns emerge. I was invited to conduct the first phase of my research from the main exhibition space at the Comox Valley Art Gallery. Here, I set up a temporary production studio for creating and broadcasting the work. With the support of CVAG, I embarked on a multi-stage process of systems design, real-time data collection & synthesis, and analytical visualization.


systems design
PROTOTYPING
Using publicly available data on loneliness, I tested theories about how different materials interact with information. Can loneliness be quantified by weight or density? Does it absorb or reflect light? How do our experiences impact one another when they’re represented as objects? What shape do we become, together?
Using the physical space to inform the composition of the work, I modelled visualizations as paper sculptures, applying form, tone and directional light to represent specific attributes of loneliness. Working iteratively using real data, the refined models became a set of rules: a visual language to be used in a modular way through the life of the project.

Comox Valley Art Gallery | education session. Jan 2023


DATA TILES
I chose to install the artwork on a 7 x 5 foot gallery board which I divided spatially into six sections. Functioning similarly to a scatterplot visualization, I created three sections describing how often a person feels lonely, and then divided these horizontally by degree of a person’s feeling of belonging in community. The spatial design of the board was led by the shape of the building blocks I created - interlocking diamonds that connect at a 60 degree angle.
Both the dimensional presentation of the tiles and their orientation have meaning in the work, as do the tone and density of the tile’s drawings.
Each data tile triangulates self-quantified attributes of loneliness, belonging and trust using shape, orientation and tone. The drawing on each represents the intensity of that person’s loneliness.

data collection & synthesis
PERFORMING DATA
Using an arts-based approach to handling qualitative data, I was exploring ways of applying systems thinking to data collection and synthesis. Perception - people’s self-reflection on their experiences - is a living thing. I wanted my approach to reflect this.
Inspired by the concept of Emergent Strategy, I made the work collaborative. Loneliness is a sensitive subject, and it was important to me that the process felt safe for people. In an effort to offer reciprocity and transparency I incorporated a feedback loop within the survey, where participants' anonymous responses activated me to visualize their data over a live-streamed broadcast. The work became a performance of data, where people could see their information being handled with care and witness the direct impact of their contribution.
In this intentional offering of my own vulnerability, I saw my own loneliness mirrored and developed a deep sense of intimacy with others in this very human experience. Through our mutual investment in sharing our experience of loneliness, we build connection and collective understanding.
Let’s be Islands Together | Livestream, Jan 21, 2023

BUILDING CONNECTION
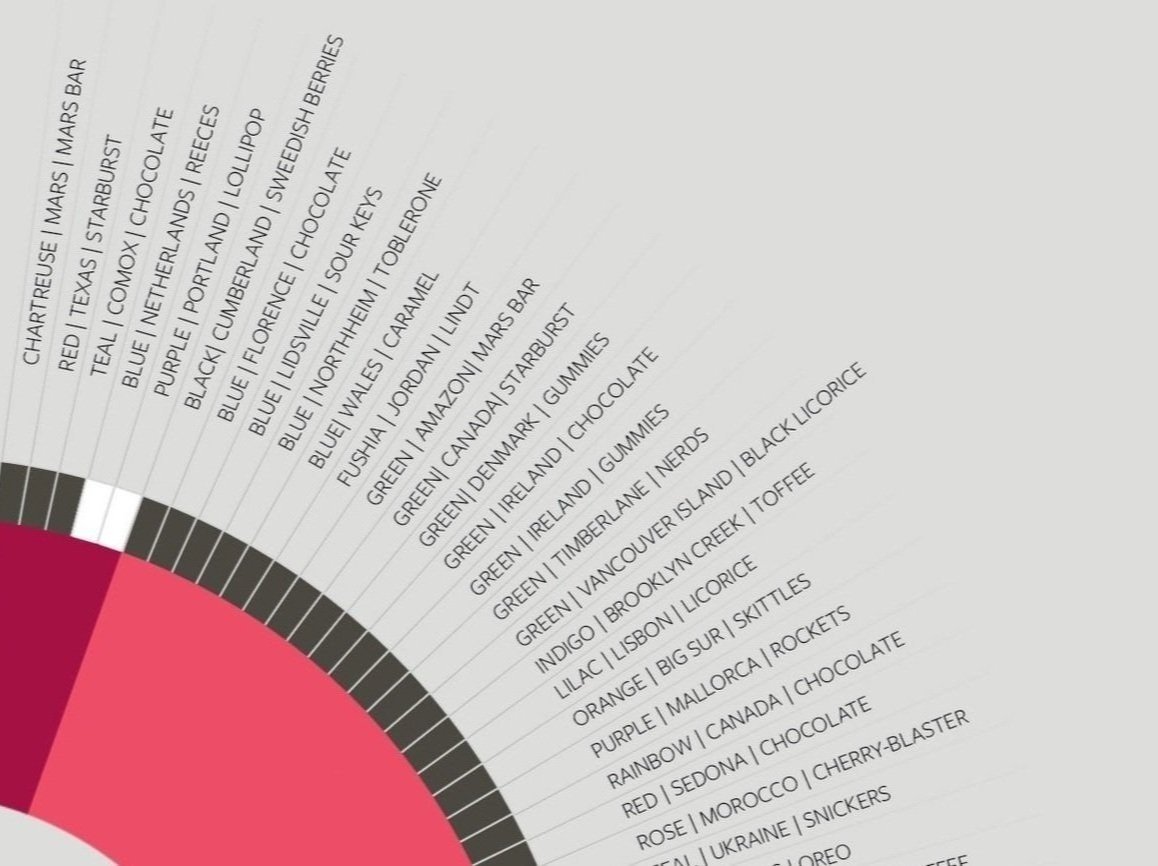
The installation of Let’s be Islands Together began with the creation and placement of the first participants data tile. Over the course of three weeks the piece blossomed into a mosaic of one hundred and eighty unique tiles, each produced in real-time as people responded to the loneliness survey.
With the incoming data as a guide, I mapped each tiny artwork in response to participants' perception of belonging and the duration of their loneliness. I could see the pencil drawings humanizing the data, my hand making visible the care that I brought to each person’s contribution. As it evolved, it became an organism, it’s emerging patterns telling a story about our relationship to ourselves and to each other.


QUALITATIVE ANALYSIS
Thirty percent of people in my community are lonesome. Sixty percent of these people feel like they don’t belong.
As a newcomer to data research, I had not expected my inquiry to generate such a rich and meaningful dataset. The information warranted deeper analysis. My research at CVAG revealed that, for the majority of participants, loneliness arises from the space where belonging should be. It’s a symptom, a response to deficient or fractured community ecosystems.
Belonging means many things for many people: it’s woven through our identities as we invent and reinvent ourselves. It’s a tapestry of our families of origin, our chosen families, our physical and online communities, and even our interactions with strangers. It’s sharing our lives with others, and the meaning that arises through that experience. It’s being able to show up unannounced, as ourselves, and welcomed. It’s what keeps us from disappearing.
Combining my design skills with my passion for data stories, I created an interactive visualization that reveals the correlation between loneliness and belonging, and how these impact community resilience.

REFLECTING
Diving deeper into the subject of loneliness, belonging and trust, I’m developing a multi-media writing / art project. Join my mailing list for iterative publications as the work progresses.
what’s next?
WORK-SHOPPING
I’m designing a workshop to explore the subject of belonging with special interest groups, community organizations and schools.